Industrial DataGraph

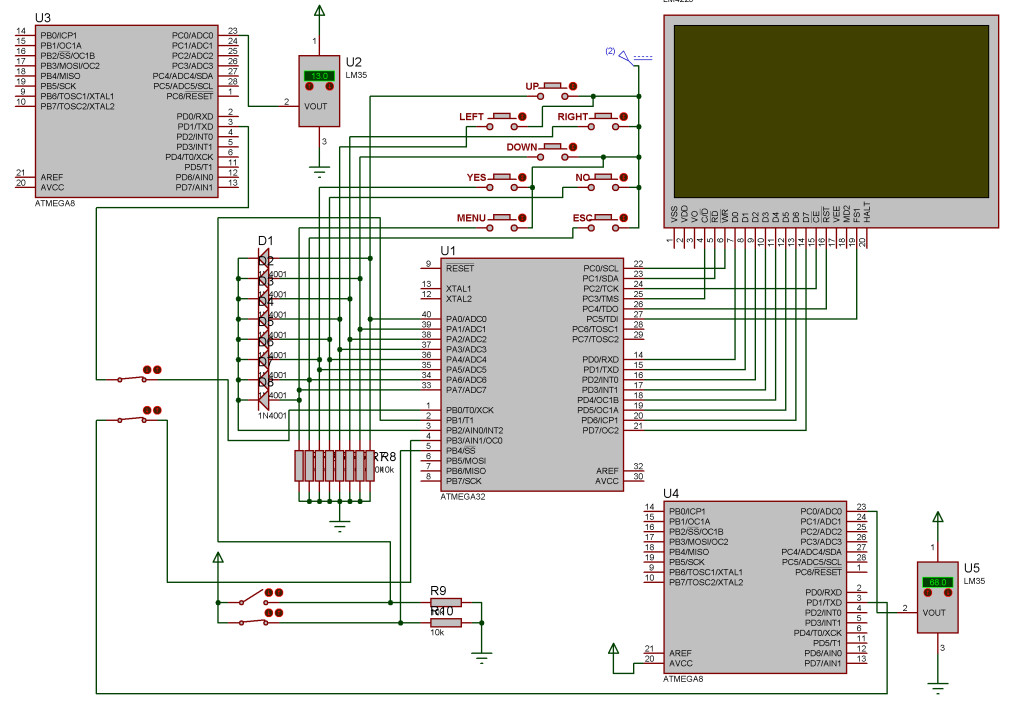
The device is measuring desired parameters by industrial sensors and performs pre-processing in slave units (if needed). After data is sending master unit by digital connections and industrial ports. finally data is shown in LCD.
This system has a powerful AVR micro controller (ATMEGA32). this MCU receives data from slave units, performs user’s processing on data and shows useful information of data on output chart in real-time mode.
UI designing is very simple and user friendly and Data is shown in two different way: Chart mode and Numeral mode. some photos of UI and two methods of view is in below gallery.
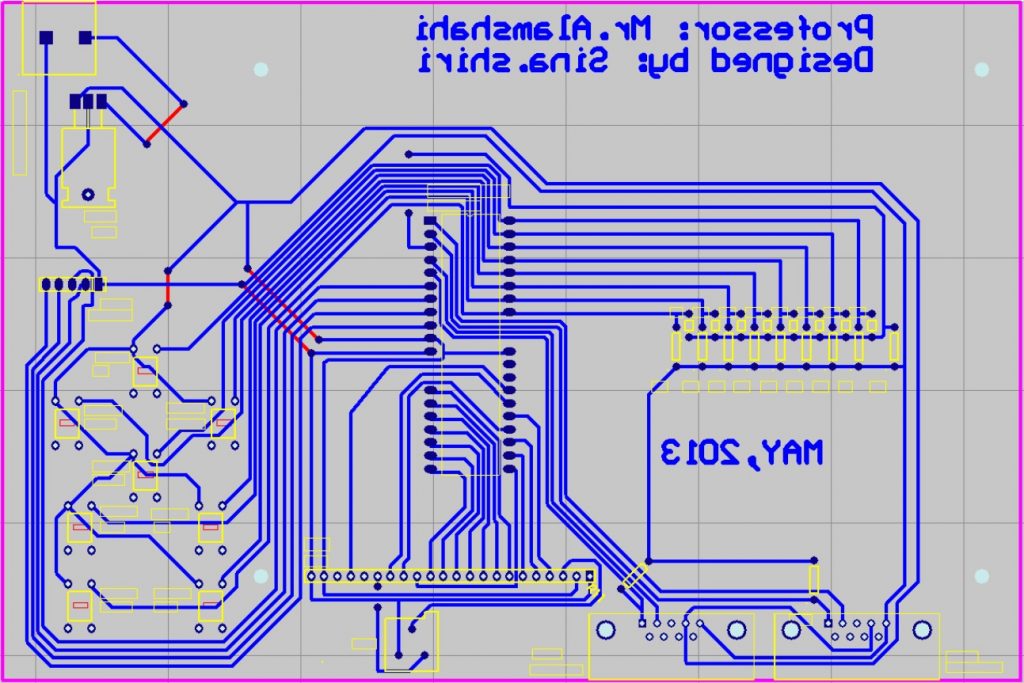
A one layer PCB is designed for this device, Buttons is mounted on PCB that user uses these buttons for moves between menus and other options.
-
Works in Noisy environment
-
Shows Data in Graphical mode
-
Language: Visual Basic
-
IDE: Bascam AVR
-
PCB: Protel 99se
-
MCU: ATMEGA32A, ATMEGA8A
-
LCD: 240 * 128 Graphical (Blue)
-
PCB (one layer)
Related links of Project:
- GitHub Repository
- Video of Running mode


